StackEx DataDump Part: 1
The dataset used is taken from Stack Exchange Data Dump published on December 15, 2016. The data set provides information about Programmers.stackexchange.com. Downloaded dataset comes in zipped format which has different .xml files. To read this data into pandas dataframe, I have used pymysql with pandas. Same pipeline procedure is used for reading .xml data to pandas dataframe:
- Create an SQL table based on the number of entries in a row of XML data.
- To Load the local XML data in that SQL table.
- In Establish a connection and load SQL table as a pandas data frame.
Tags dataset has 1628 different tags for various post. Each tag has an associated count value with it.
Tags Table
| Id | TagName | Count |
|---|---|---|
| 1 | comments | 152 |
| 3 | code-smell | 99 |
| 4 | programming-languages | 1205 |
| 5 | usage | 7 |
| 7 | business | 121 |
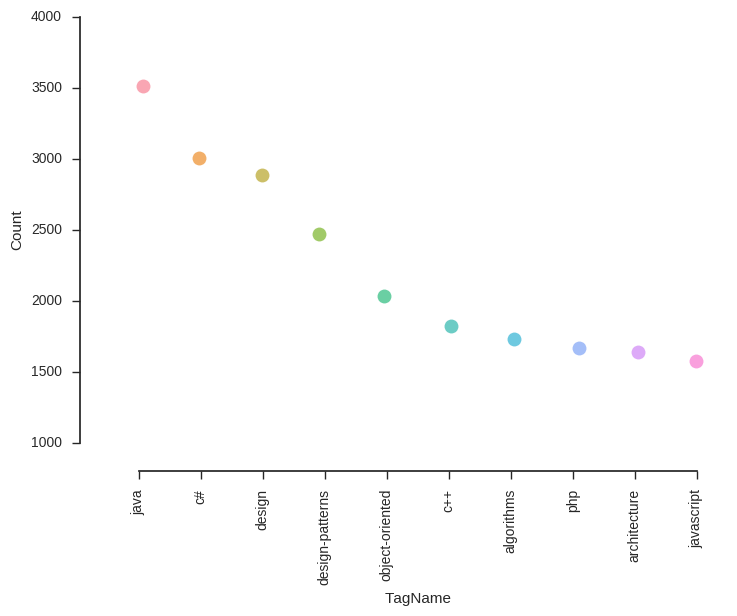
Top 10 Tags based on count
Tags Table
| Id | TagName | Count |
|---|---|---|
| 37 | java | 3511 |
| 116 | c# | 3007 |
| 265 | design | 2886 |
| 174 | design-patterns | 2475 |
| 107 | object-oriented | 2036 |
| 226 | c++ | 1822 |
| 142 | algorithms | 1732 |
| 68 | php | 1667 |
| 331 | architecture | 1639 |
| 319 | javascript | 1578 |
Taking all the posts that contains python in their title or tag column. Now, the most popular posts can be chosen based on Score, ViewCount, AnswerCount, CommentCount, FavoriteCount.
Top 5 posts based on Score
- Why do people hesitate to use Python 3? (191)
- What are the drawbacks of Python? (147)
- Is it always a best practice to write a function for anything that needs to repeat twice? (123)
- Why is Python used for high-performance/scientific computing (but Ruby isn’t)? (95)
- Are there any design patterns that are unnecessary in dynamic languages like Python? (85)
Top 5 posts based on ViewCount
- How is Python used in the real world? (249407)
- What are the drawbacks of Python? (152080)
- How do I learn Python from zero to web development? (110434)
- R vs Python for data analysis (100492)
- Why use try, finally without a catch clause? (75408)
Top 5 posts based on AnswerCount
- What are the drawbacks of Python? (24)
- Why such popularity with Python? (16)
- Python and only Python for almost any programming tasks! (15)
- Is it always a best practice to write a function for anything that needs to repeat twice? (15)
- How is Python used in the real world? (14)
Top 5 posts based on CommentCount
- Is it always a best practice to write a function for anything that needs to repeat twice? (24)
- Is C# development effectively inseparable from the IDE you use? (18)
- Can I really make python work with VBA (18)
- Detect if code is C (18)
- Why is Python 3.4 still developed after the release of 3.5? (18)
Top 5 posts based on FavoriteCount
- What are the drawbacks of Python? (113)
- How do I learn Python from zero to web development? (103)
- Why do people hesitate to use Python 3? (69)
- R vs Python for data analysis (63)
- Why is Python used for high-performance/scientific computing (but Ruby isn’t)? (50)